BTC 当期趋势与价格区间
图一为 BTC/USDT 的日线级别走势图,从图片中可以清楚看到白色水平压力带所标示的价格阻力区间在 2025 年 5 月被触及后,价格随即出现了显著的回调,要注意的是,在 2025 年 2 月期间,价格也曾在此区间附近经历了一段盘整,未来则需留意成交量以及价格走势是否做出突破或是跌破盘整区间的动作。

(图一,来源:TradingView 2025.5.6)
BTC 重点关注与目标价格
图二为 BTC/USDT 的 4 小时线级别走势图,图中的白色区间带可视为关键的压力区间,而黄色上升趋势线则是短线上的重要支撑,绿色水平线则构成了目前盘整区间的下缘支撑。未来,若价格跌破黄色趋势线,需要重点留意约 92,700 的支撑位,若该支撑失守,价格可能进一步下探至 91,000 附近 ; 相反,若价格能向上突破 96,000 的阻力区间,则可专注于 98,000 - 100,000 的目标区间。
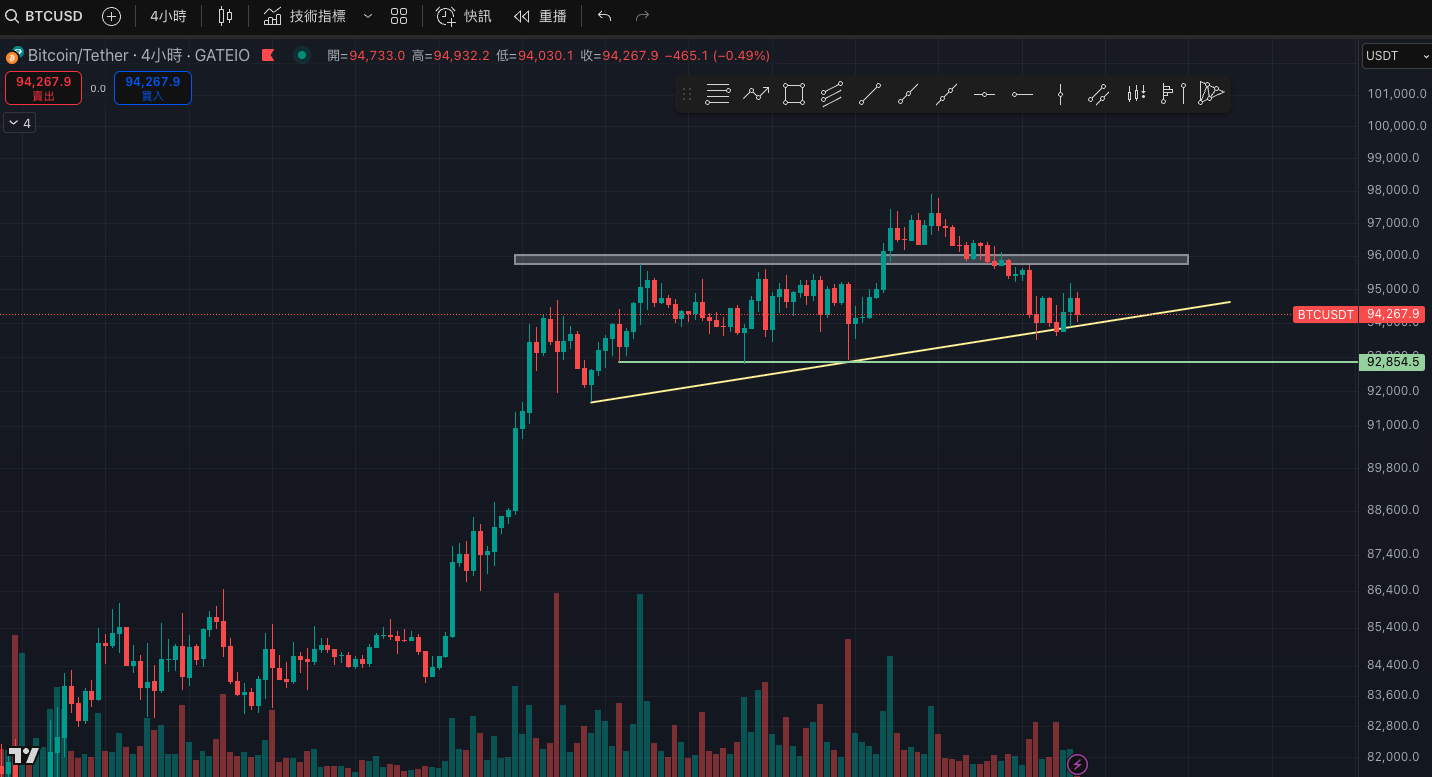
(图二,来源:TradingView 2025.5.6)
开始进行 BTC 现货交易:https://www.gate.io/trade/BTC_USDT
总结
眼睛前 BTC 处于关键压力测试阶段,若价格无法有效站稳 96,000 美元区间之上,短线仍有回测 92,700 至 91,000 美元支撑的可能,一旦成功突破该压力带,市场动能有望推升至 98,000 至 100,000 美元的整数关卡,在趋势未明朗前,应持续观察成交量与价格行为,采取更为谨慎与弹性的策略应对。
作者: Allen
* 投资有风险,入市须谨慎。本文不作为 Gate 提供的投资理财建议或其他任何类型的建议。
* 在未提及 Gate 的情况下,复制、传播或抄袭本文将违反《版权法》,Gate 有权追究其法律责任。
相关文章

新手
比特币最新动态:价格走势与市场前景解析
截至 2025 年 6 月 5 日,比特币( Bitcoin )价格约 105,031 美元,24 小时高点 105,993.1 美元,市场波动加剧。本文简要解读最新行情、长线持仓动向与专家预测,帮助新手快速把握投资机会与风险。
6/5/2025, 3:46:08 AM

新手
2025 年特朗普关税政策深度分析
政策实施后,全球金融市场动荡,国际贸易格局初步变化。对美国自身而言,经济增长面临下行压力,通胀压力增大,产业结构调整面临挑战,就业市场受到冲击,国内社会和政治反应不一。对中国,贸易规模缩小,出口商品结构改变,相关产业受到冲击,但也在一定程度上推动了经济转型和市场多元化。对其他经济体,欧盟采取反制措施,经济受到多方面影响;东南亚国家面临订单转移和原产地规则判定模糊等挑战,但也有产业转移等机遇。
4/10/2025, 9:41:40 AM

新手
一文了解TRUMP代币:$TRUMP代币全面解析
TRUMP是一款以“$TRUMP”符号及其艺术品为核心的meme币项目,致力于通过代币经济模型和社区文化表达对特定价值观的支持,同时保持非政治性。本文将围绕其代币经济模型、运营策略、社会与经济影响以及发展潜力展开详细解读,为读者提供清晰的视角。
1/19/2025, 9:39:42 AM

新手
比特币价格暴跌至 $104,000:中东冲突引发市场恐慌
本文深入剖析 Bitcoin Price Crash To $104000 的背后原因,解读以色列对伊朗军事行动引发的市场恐慌,以及对投资者的影响与应对策略。
6/13/2025, 9:07:35 AM

新手
解密 TRUMP 代币:OFFICIAL TRUMP 模因币
发现 TRUMP 代币,这是候任总统唐纳德·特朗普在 Solana 上推出的模因币。了解它如何改变政治和数字资产。
1/19/2025, 9:55:52 AM

新手
比特币最新行情观察:Bitcoin 价格突破 105,000 美元,涨势或未止步
结合 2025 年 6 月 5 日 Bitcoin 最新价格约 105,031 美元,以及美国法院阻止特朗普关税的利好消息,分析其对市场的短期影响。
6/5/2025, 4:12:49 AM
即刻开始交易
注册并交易即可获得
$100
和价值$5500
理财体验金奖励!